


Paleomagnetic Data Plotter
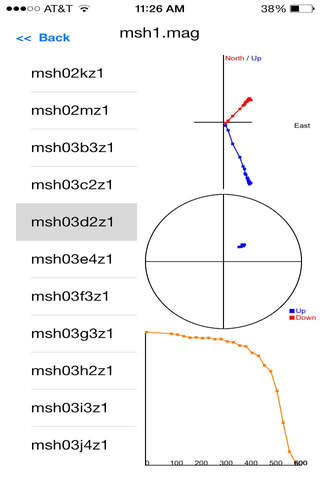
The Paleomagnetic Data Plotter analyzes paleomagnetic data using 3 different graphs (Zijderveld, Equal Area, Intensity Decay).
All you have to do is email a data file to yourself with the following requirements
1. The file must be ascii
2. The file must have the following values separated by whitespace
name, treatment, anything, intensity, declination, inclination, ...
name treatment csd intensity declination inclination ...
msh02kz1 0.00 0.7 `2.186E-4 57.8 -1.7 1/1/15
The third column may be anything (i.e. csd) except the required columns listed above. Any columns following inclination are also acceptable (i.e. date, user)
3. The file MUST have a .mag extension